case study

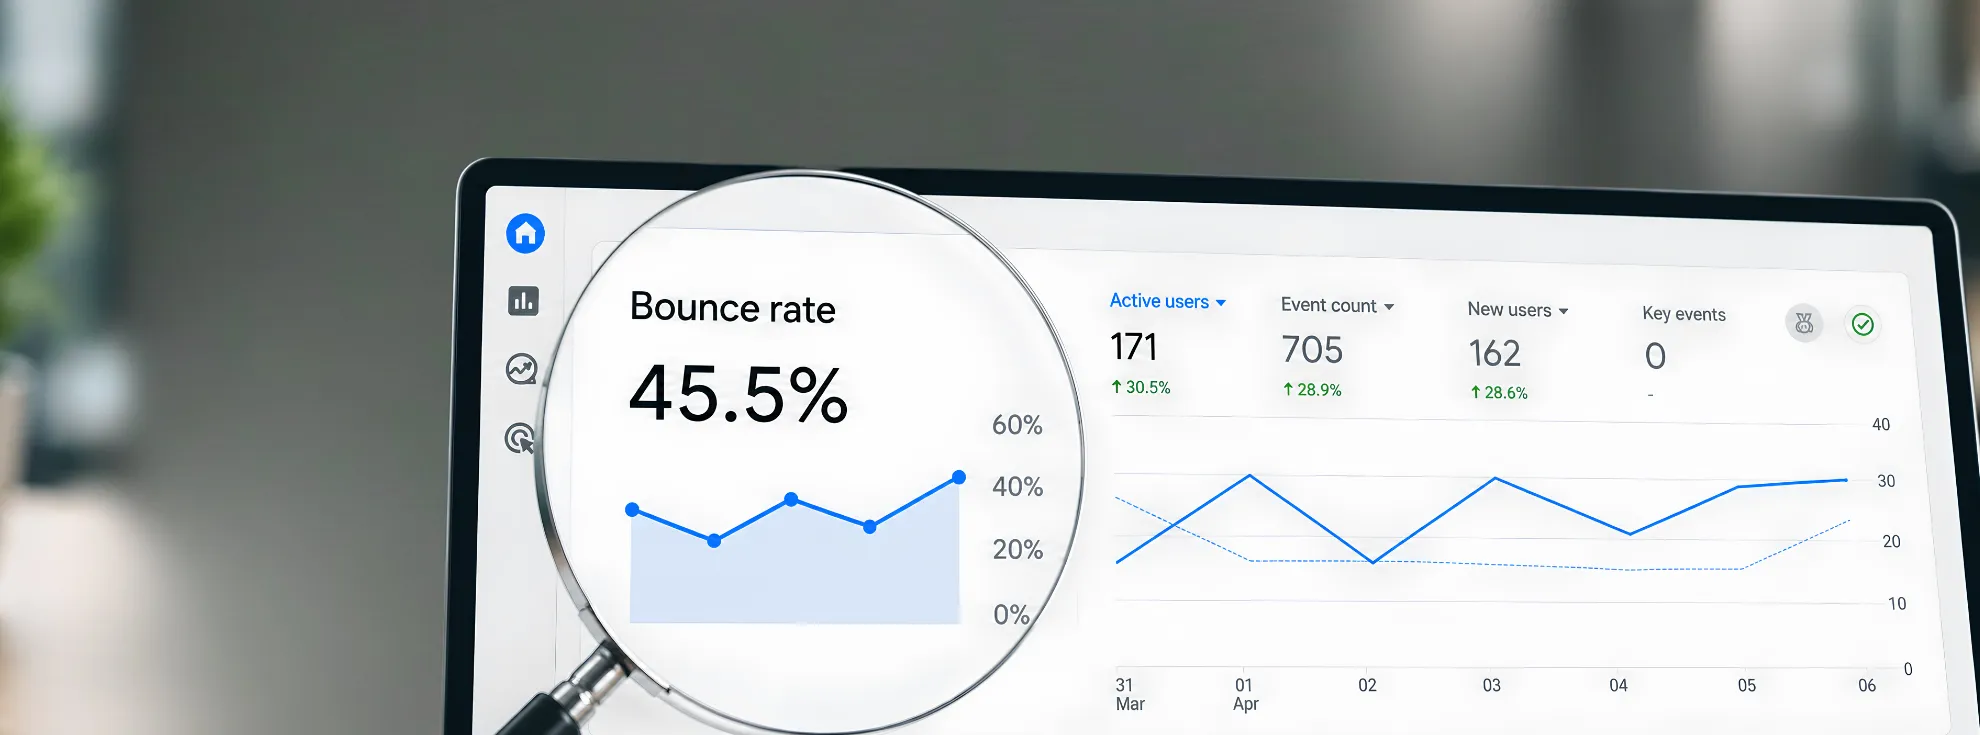
Bounce rate shows how often visitors leave without meaningful engagement. A high rate is not always bad, but it can reveal issues with search intent, content, usability or targeting. The key is to read it alongside conversions and engagement data, then fix the real cause.
When a visitor lands on your website, finds exactly what they need and leaves, is that a bad visit? Not necessarily. Bounce rate is the percentage of sessions that were not engaged, making it an important metric for understanding how visitors interact with a website.
A high bounce rate can sometimes point to poor search intent alignment, weak content, slow page speed or usability issues. But it can also be completely normal when a visitor finds the information they need and leaves. The key is to look beyond the percentage and understand why visitors leave and whether the page achieved its purpose.
Bounce rate is the percentage of sessions on your website that were not engaged.
With Google Analytics 4 (GA4), the way bounce rate is measured differs from the approach used in Universal Analytics.
To understand bounce rate in GA4, you first need to understand what Google considers an engaged session. A session is considered engaged if it:
A session that meets none of these conditions is considered unengaged. Therefore, in GA4, bounce rate is the percentage of sessions that were not engaged.
This differs from Universal Analytics, where bounce rate was primarily associated with sessions in which users viewed only one page and triggered no further interaction. GA4 instead focuses on whether a session meets its engagement criteria, giving marketers a more useful way to understand visitor behaviour.
The current bounce rate formula in GA4 is straightforward:
Suppose your website receives 1,000 sessions, and 350 of them do not qualify as engaged sessions.
There is another easy way to understand this formula:
Google confirms that the two metrics are opposites in GA4. If your engagement rate is 72%, your bounce rate is 28%.
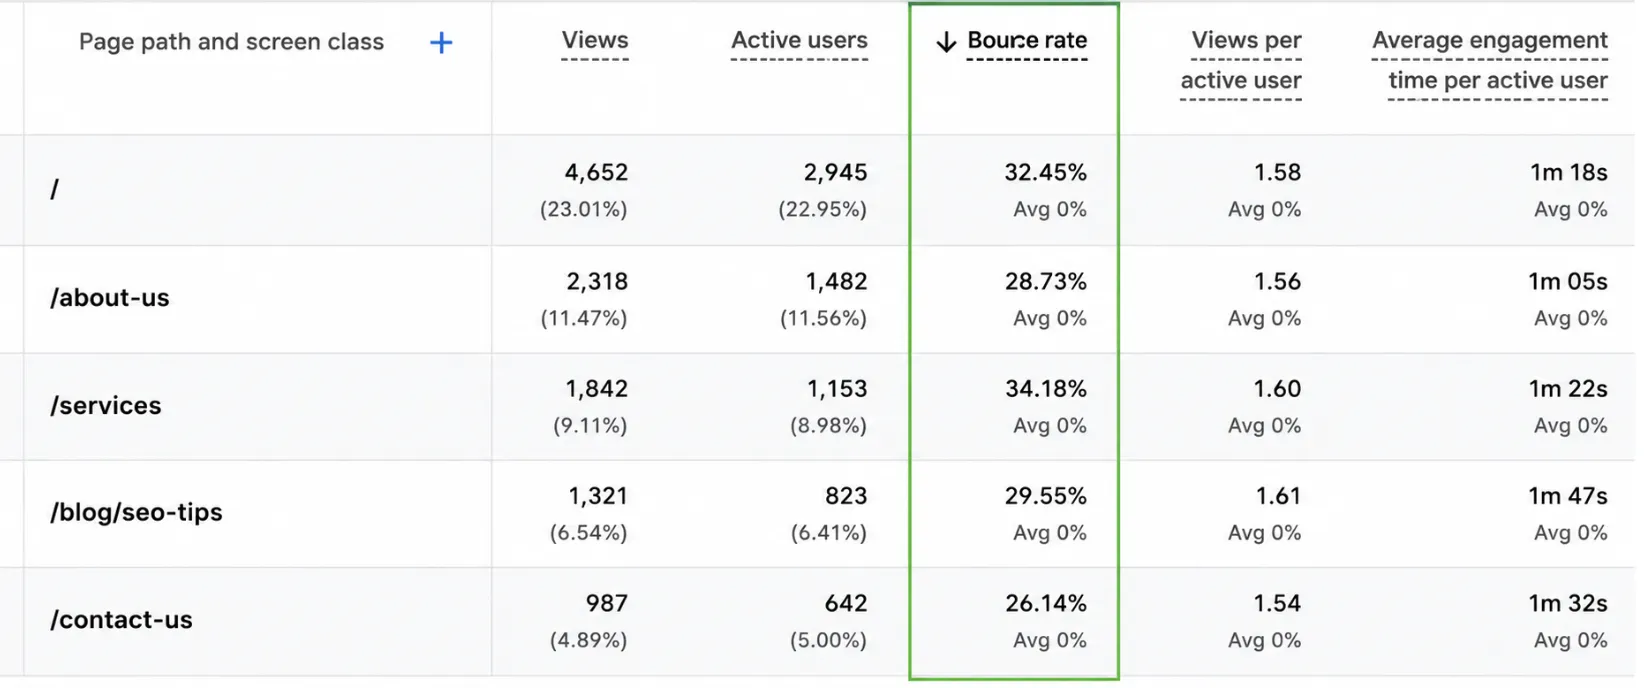
No. This is where the metric is more useful when read in context.
Pages are different for different reasons. A successful experience for a visitor who reads a blog, finds the answer and leaves. If a user lands on a service page and leaves immediately without understanding the offer, that could be a much bigger issue.
Consider these examples:
| Page Type | What a Higher Bounce Rate Could Mean |
|---|---|
| Informational Blog | The reader may have found the answer they needed without exploring further. |
| Contact Page | A visitor may copy a phone number or address and leave after completing their task. |
| Service Page | The offer may not match the visitor’s expectations or search intent. |
| Product Category Page | Visitors may struggle with navigation, relevance, price or product choice. |
| Campaign Landing Page | The ad message, offer or page experience may not be convincing enough. |
This is why there is no universal number that automatically qualifies as a “good” bounce rate. Page purpose, industry, traffic source and device can all influence what users do after arriving.
A useful benchmark is your own historical performance against similar pages and audiences.
| Metric | What It Means | What It Can Tell You | How to Check |
|---|---|---|---|
| Bounce Rate | The percentage of sessions that were not engaged. | Shows how often visitors leave without meeting GA4’s engagement criteria. | In GA4, add Bounce Rate to a detailed report such as Pages and Screens. |
| Engagement Rate | The percentage of sessions that were engaged. | Shows how often visitors meaningfully interacted with your website based on GA4’s engagement criteria. | Find Engagement Rate in GA4 reports and compare it with Bounce Rate for the same pages or traffic sources. |
The bounce rate metric you see today in Google Analytics is not the same as what many marketers remember from Universal Analytics.
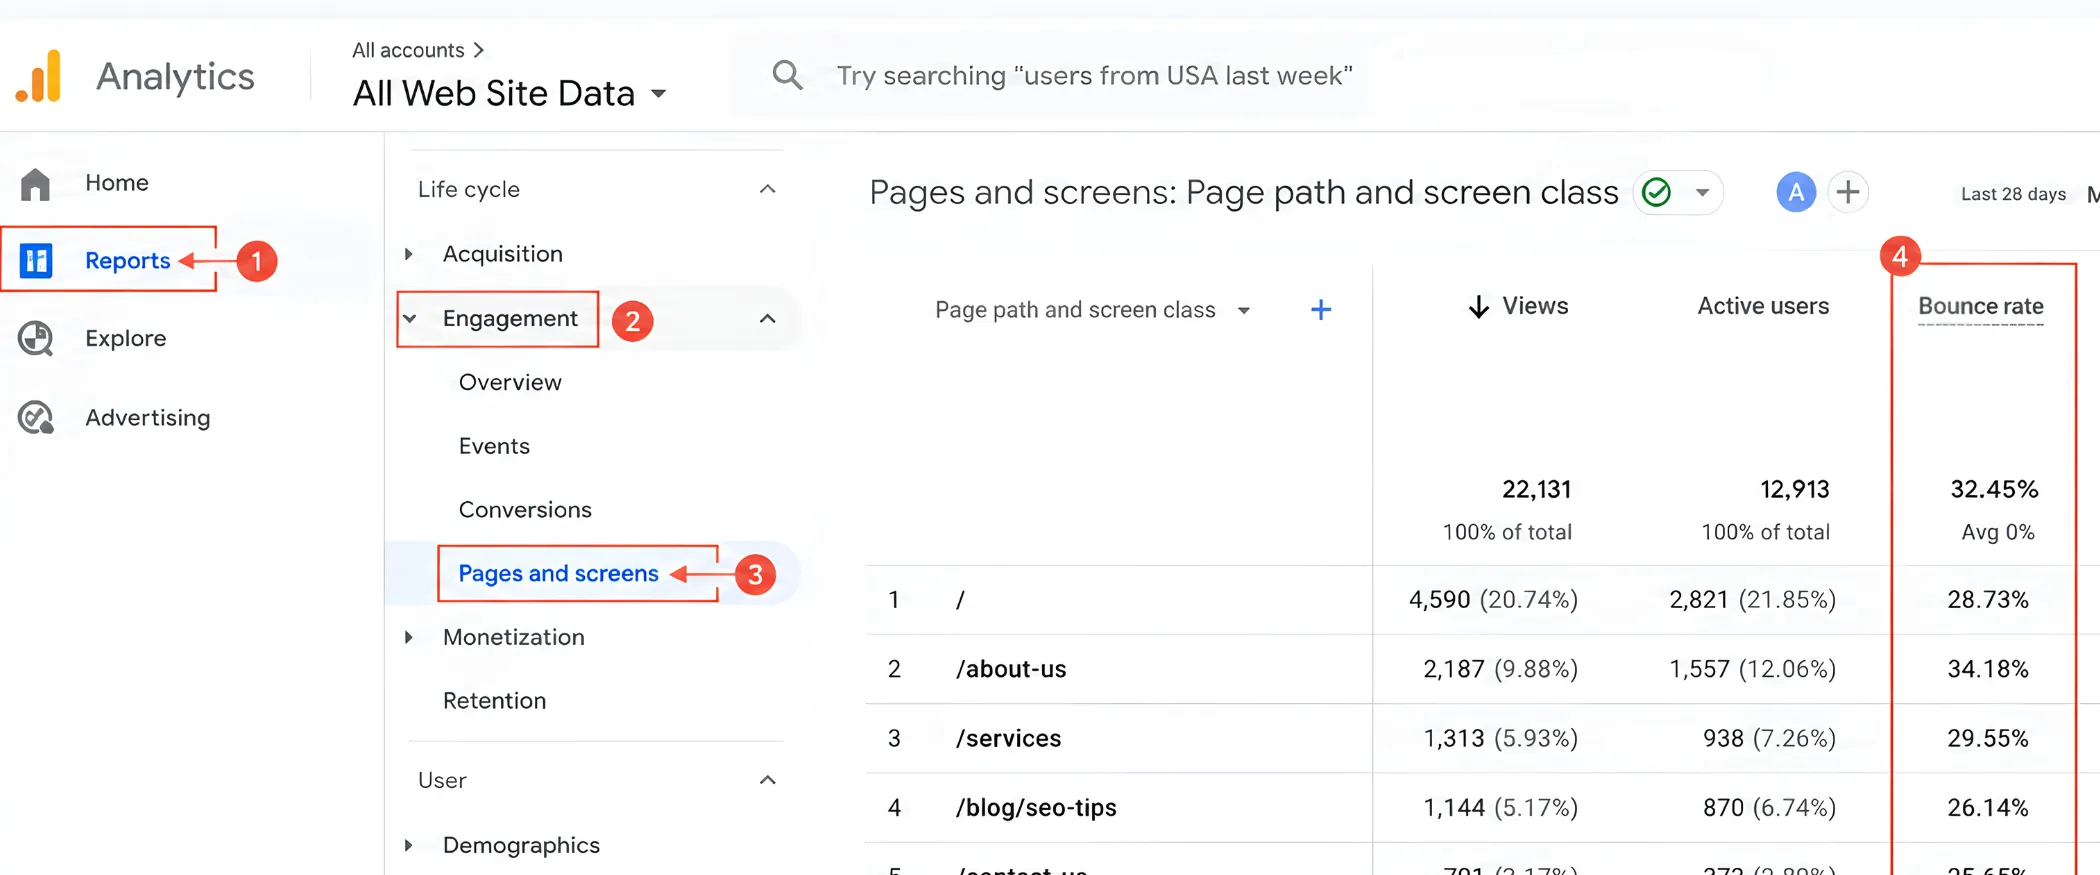
Most of the standard reports in GA4 do not automatically include bounce rate. Users with the appropriate permissions can add it to detailed reports such as Pages and Screens.
The process is:
You can then compare the metric across pages rather than relying on one site-wide percentage.
This makes bounce rate in Google Analytics analysis far more useful. A site average may hide one poorly performing landing page or one traffic source bringing unsuitable visitors.
The connection between bounce rate in SEO performance and rankings is often over-simplified.
Don’t think of the GA4 metric as a ranking score in isolation. It’s more useful as a diagnostic signal that can expose issues such as poor intent alignment, weak content, technical problems or an unconvincing page experience.
Let’s say you have a page that gets decent organic traffic but very little engagement, and no real actions. That gives an SEO agency a reason to explore the query, landing page, content structure and visitor journey rather than just celebrating the ranking.
This is how Blacklisted approaches bounce rate in SEO analysis. We look at what the metric reveals about search intent and website behaviour instead of chasing a lower percentage for reporting purposes.
Knowing what bounce rate is is useful, but understanding why visitors disengage gives the metric real value. A high bounce rate can be a symptom of a bigger issue. The next step is to identify what is causing visitors to leave:
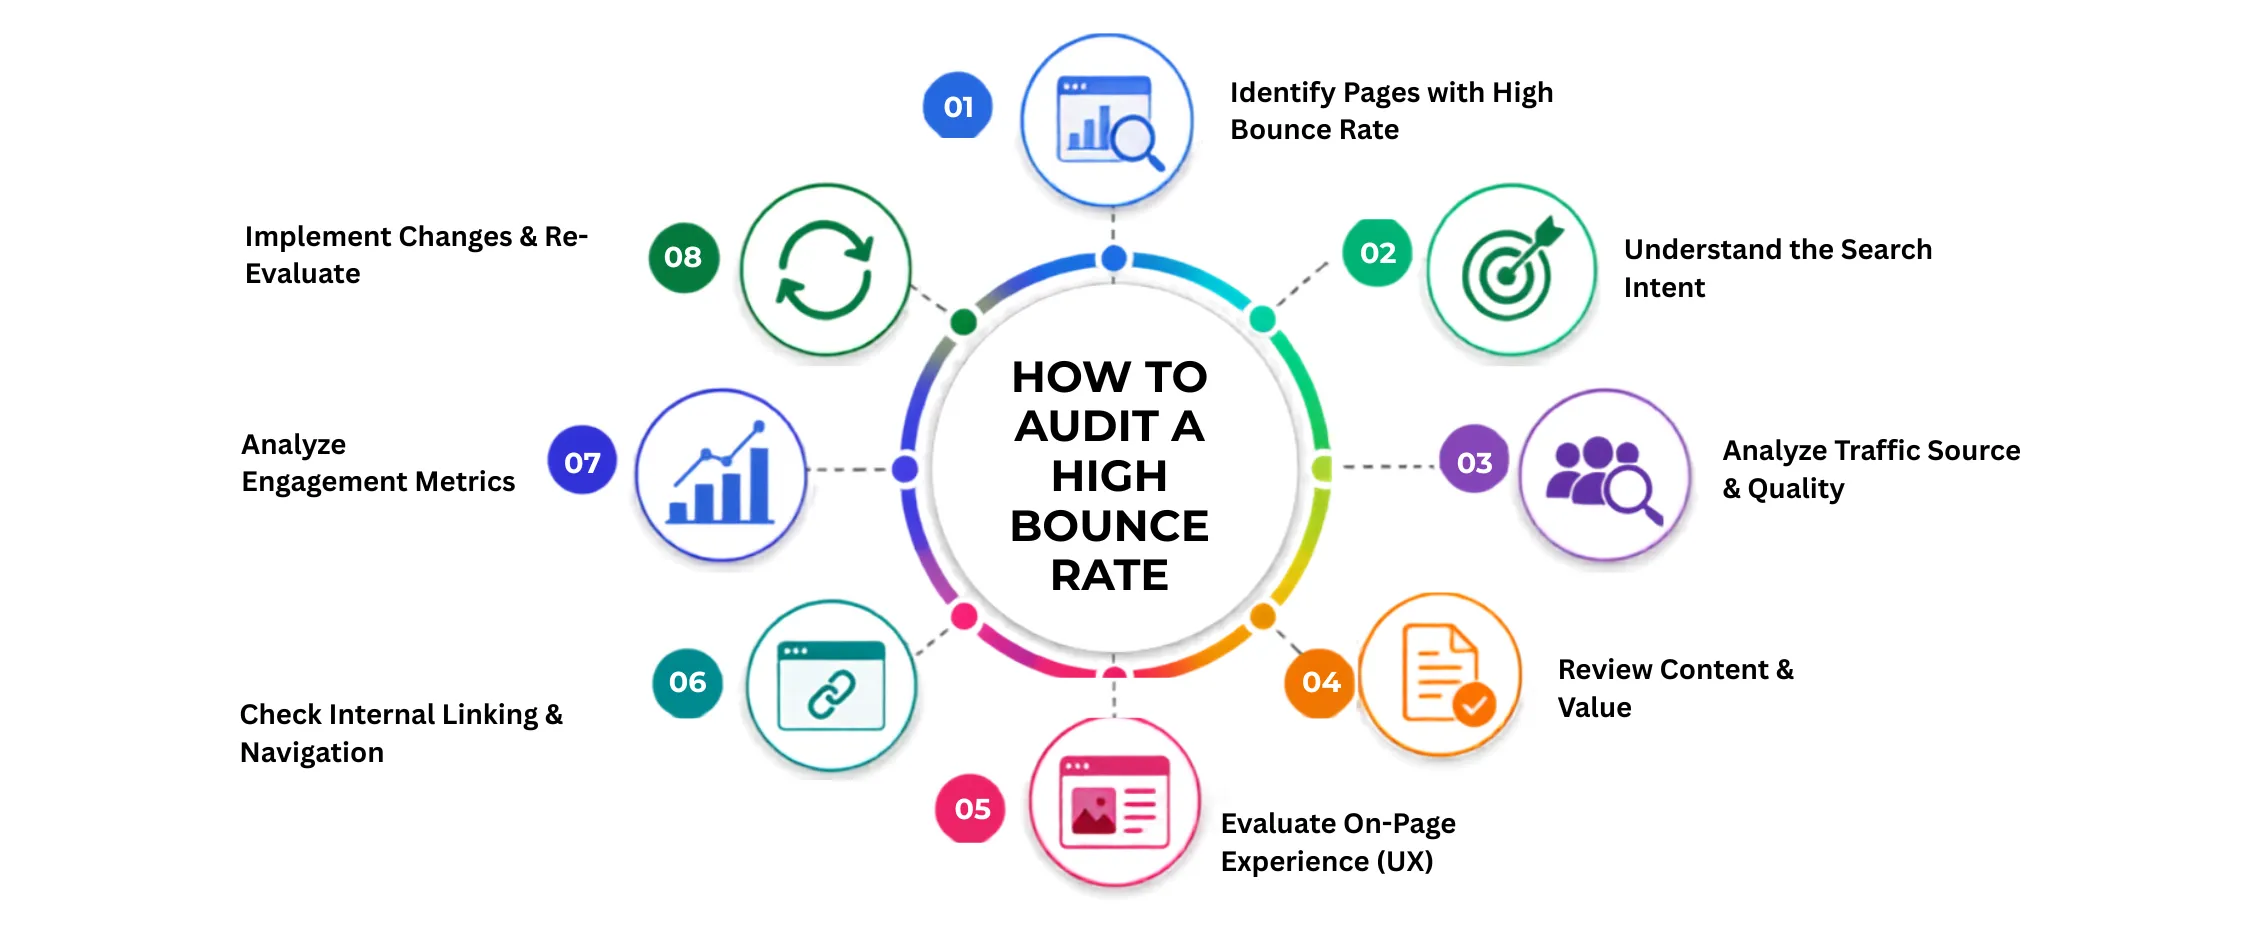
A high bounce rate doesn’t always mean the page is performing badly. The important part is finding why visitors are leaving. A simple audit can help you identify whether the issue is search intent, content, traffic quality, page experience or conversion.
The goal of a bounce-rate audit isn’t simply to lower the percentage. It’s to find where the visitor journey breaks down and fix the problem that is affecting engagement or conversions.
The goal should not be “make the bounce rate lower”. It should be: make the page more useful for the people it attracts.
Start with these improvements:
| Improvement | What to Do | How It Can Support SEO & Traffic |
|---|---|---|
| Match the Page With Search Intent | Compare the page with the keywords and queries bringing visitors. Make sure the content answers the reason they searched. | Better intent alignment can make the page more relevant to searchers and help attract more qualified organic traffic. |
| Improve the Above-the-Fold Experience | Make the headline, supporting copy and primary value proposition clear immediately. | Visitors can understand the page faster, reducing confusion and helping them continue through the content or conversion path. |
| Make Content Easier to Navigate | Use descriptive H2s, short paragraphs, lists, examples, images and clear sections. | Better structure helps users find answers quickly and makes important information easier for search engines and AI systems to understand. |
| Strengthen Internal Linking | Link to relevant guides, service pages, case studies and supporting content where it genuinely helps the reader. | Strong internal links help users discover useful content while helping search engines understand your site’s topic relationships and important pages. |
| Improve Mobile Experience | Test navigation, buttons, forms, text size, images and page layout on real mobile devices. | A better mobile experience can reduce friction for mobile search visitors and improve the usability of organic landing pages. |
| Improve Page Speed & Technical UX | Check loading performance, layout stability, broken elements and unnecessary scripts. | Faster, more usable pages provide a better experience for search visitors and can support stronger overall page performance. |
| Compare Traffic Sources | Segment organic, paid, social and referral traffic instead of relying on one overall bounce-rate number. | Identifies low-quality or mismatched traffic so you can improve targeting without making unnecessary changes to pages that perform well. |
| Strengthen the Next Step | Add relevant CTAs, related resources and contextual links based on the visitor’s intent. | Helps turn organic visitors into deeper site engagement, leads and conversions instead of treating traffic as the only goal. |
Bounce rate is useful when you look at why visitors leave, not just the percentage itself. In GA4, bounce rate shows the share of sessions that were not engaged, but a higher rate does not automatically mean a page is underperforming.
To improve bounce rate, start by checking search intent, content relevance, traffic quality, mobile experience, page speed and conversion paths. Compare the metric with engagement and conversions to understand what is really happening.
At Blacklisted, we use bounce rate as a diagnostic signal not a number to chase. As an SEO agency, we help businesses identify gaps in search intent, content and user experience so their organic traffic has a better chance of turning into meaningful engagement, leads and business growth.

We are your go-to source for everything digital. We cover marketing tips, design trends, new tech, and how to build your brand. Every post has useful information to keep you updated and ready to tackle the digital world. It’s not just articles; it’s a way to learn, grow, and connect with others navigating the same digital journey.